RWI is an abbreviation of Random Walk Index. The technical indicator was developed by Michael Poulos and published in Technical analysis of Stocks and Commodities in February 1991 (the article was called "Of trends and random walks"). The main goal of the indicator is to determine whether the price is significantly trending or whether it makes just some random movements up and down (moving sideways). Because the RWI is a trend indicator, we can use it in similar ways as we use the ADX or Aroon indicators.
As stated above, the aim of RWI is to calculate how the price movements differ from what would be considered as just a "random walk". Mathematician William Feller, specialized in probability theory, has proved that a random walk generated by tossing a coin (head = one step forward; tail = one step backward) would, maybe a little bit surprisingly, show a displacement from the starting point. The displacement distance would depend on the square root of the number of tosses. Any move beyond the square root edge can be considered as not just random movement but as a trend.
That is exactly how the RWI indicator works. It measures the ratio of an actual price move to the expected random walk of the price. If the price move is larger than a random walk, the RWI values would be larger than 1.0. That would mean a trend. On the other side, if no trends were present, the index values would be exactly on the square roots (i.e. would equal to 1.0).
To conclude this, the RWI calculation looks like follows:
The Random walk index measures 2 different variables. One of them measures the uptrend and the second one measures the downtrend. The higher the numbers are, the stronger the trend is. Low numbers below 1.0 would mean very weak trend (if just one variable is lower than 1.0 that could mean that the opposite trend is dominant, but if both variables are lower than 1.0, then the whole market is choppy and moving sideways).
The RWI High and Low formulas:
RWI of High = (H – Lt) / (ØDR x √n)
RWI of Low = (Ht – L) / (ØDR x √n)
How to understand the formulas? Well, first of all you should choose some days for RWI calculation. So, if you decide to calculate it for e.g. 10 days then you have to calculate it for each day separately. The first RWI of High is today’s High minus Low "t" days ago (in this case 1 day ago). The next RWI of High would be today’s High minus Low 2 days ago etc. You would have to calculate all the differences between the first 1 and the previous 9 days ago. Each difference must be divided by (Average daily range multiplied by the Square root of the days). The actual RWI value is the highest one of all the 9 values within the last 10 days.
Only few technical traders (and almost none of the technical analysis websites) realize that the first RWI you can calculate is always the actual High minus the Low 1 day ago. You can not calculate the difference of the same day’s Low because in such case the daily range would be the same number, the square root of 1 is also 1, so the final result would be always 1. That is the reason why you should always start the calculation as (today’s High minus yesterday’s Low) divided by (Average daily range for these two days multiplied by the Square root of n = 2). That means the first result (High minus Low-1 day ago) is the RWI for 2 days (RWI 2) etc.
The same rules apply to calculation of RWI of Lows – you just have to use the actual Low which will be compared to the previous Highs.
Here is an example of how the indicator works (for identifying an Uptrend).

Let’s imagine 3 consecutive up days when the price will rise by 3, 2 and 1 point (e.g. from 10 to 16 points). To simplify this, the Open equals the Low and the Close price equals the High. In this case all the RWI High values would be:
(16 – 13) / (1.50 x √2) = 1.41
(16 – 10) / (2.00 x √3) = 1.73
The actual RWI is always the highest value, so the RWI 3 = 1.73 points. This variable is higher than 1.0 and signalizes an Uptrend in the market. The same applies for the RWI of Lows (just vice versa).
Let’s imagine a different situation. The price will rise by 2 points for 2 consecutive days but the third day it will fall by 4 points (so the price will change from 10 to 12 (+2), to 14 (+2) and again to 10 (-4)).

In such case the RWI High variables would be:
(14 – 12) / (3.00 x √2) = 0.47
(14 – 10) / (2.67 x √3) = 0.86
And the actual RWI 3 is 0.86 points. The variable is lower than 1.0 and signalizes no significant Uptrend, just some random moves.
The last situation we would like to draw your attention to, is the decreasing price. Let’s suppose the price will fall from 10 points to 8 points (-2), then rise to 9 points (+1) and finally fall to 6 points (-3).

In such case the RWI High variables would be:
(9 – 8) / (2.00 x √2) = 0.35
(9 – 8) / (2.00 x √3) = 0.29
The RWI High variable is very low, signalizing us the absence of any uptrend. On the other side, and in the same time, the RWI Low would be:
(9 – 6) / (2.00 x √2) = 1.06
(10 – 6) / (2.00 x √3) = 1.15
Which would signalize a strengthening downtrend (RWI Low is higher than 1).
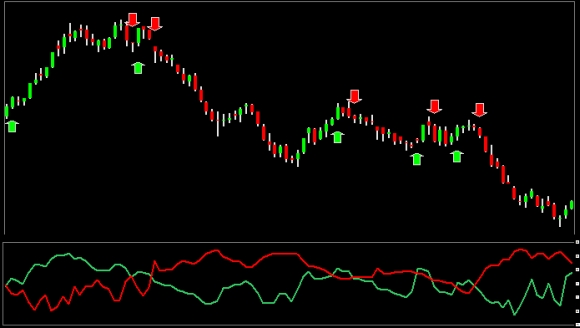
To see how the RWI looks applied to a price chart, look at the images below:

The green curve stands for RWI High. The red curve stands for RWI Low.
There are also some buy and sell signals added to the chart. When RWI High gets higher than RWI Low, the buy signal appears. When the RWI Low gets higher than the RWI High, the sell signal appears. Both RWI values were calculated during the last 50 days.
The following image shows how it would look like if the RWI would be set to short-term 5 days.

The RWI indicator lets the market determine the look back interval for price movement analysis. While ADX, Aroon or Hull moving average use fixed time periods, RWI can adapt periods in line with the changing conditions in the market (the biggest difference between actual H/L and the L/H n days ago). That is a huge advantage of RWI and makes it one of the best trend indicators ever.
How to use the indicator for technical trading:
The short-term RWI is a good overbought/oversold indicator and the long-term one is a very good trend indicator.
- Michael Poulos suggested a trading strategy that combines the short-term RWI with the long-term one. Short-term RWI is usually set from 2 to 7 periods while the long-term one is set from 8 to 64 periods. Poulos suggests to buy the asset when the long-term RWI High gets over the 1.0 limit and the short-term RWI Low is also higher than 1.0. That would mean currently oversold conditions while the long-term uptrend gets stronger and stronger (a good time to buy the asset or at least to close the short position).
- On the other side the technical trader should sell the asset when the long-term RWI Low gets over the 1.0 edge and the short-term RWI High is above the limit, as well. That would mean overbought conditions in the market and a strengthening long-term downtrend at the same time.
- In our opinion the best strategy is to follow just the Long RWI. When the RWI High is higher than the RWI Low it is time to buy - and vice versa. These signals are simple and work great (as you could see in the image above).
- The indicator can be used to determine which assets are trending well and which are not (e.g. Poulos himself was quite surprised by the finding that corn futures contract was trending much better than was the wheat). This is very important when you are choosing the right assets for your technical trading strategy. This way you can decide where to use the trend following indicators (KAMA, ZLEMA, Zig zag, TRIX, MACD etc.) and where to use the counter-trend indicators (TSI, RSI, Stochastic or even better STC etc.).
As with almost all of the technical indicators the best thing every trader can do is to test his own data, his own settings, and his own rules how to trade. Surprisingly, sometimes the best result can be achieved with settings that are not common and rules that are quite strange at a first glance – the more things a trader can change and experiment with the better for him and his trading results.
