Zig Zag (also zigzag indicator) is popular especially among technical traders whose aim is to identify current trend on the market. This indicator is used to remove the market noise from the price chart, so the trend can become much clearer. Unlike other indicators of technical analysis it does not compute exact numbers that would signalize the right time to sell or buy. It is more like chart patters – it is being drawn in a chart and makes the trend (also price swings) more visible. Zig Zag calculation can be based on more types of prices. It is usually calculated on Close prices, but can also be based at the High and Low average prices or OHLC prices.
The basic idea that stands behind this indicator is that all the price swings that are lower than the defined filter are not taken into consideration. That means if we define a filter of e.g. 5 % price change, the zigzag line (leg) changes its direction just after the price falls or rises in the opposite direction at least by the pre-defined percentage or more. Any lower price reversals are not taken into consideration at all. Once the move in the opposite direction is confirmed and even increased, the new zigzag leg will stretch to the new minimum or maximum value. In other words – it is being stretched every day the price confirms new trend and does not change while the price moves sideways or in the "wrong" direction by a lower amount than the predefined filter is. All this means that every UP leg must be followed by a DOWN leg (or by a temporary free space) and every DOWN leg must be followed by an UP leg. There can not be two or more UP legs which follow each other – being a common mistake in zigzag calculation or chart drawing (because more following UP or DOWN legs must be always connected into a longer one).
You can see the Zig Zag trend indicator in the picture below (the first picture shows 5 % price filter, the second one 10 % filter, both calculations based on Close prices).
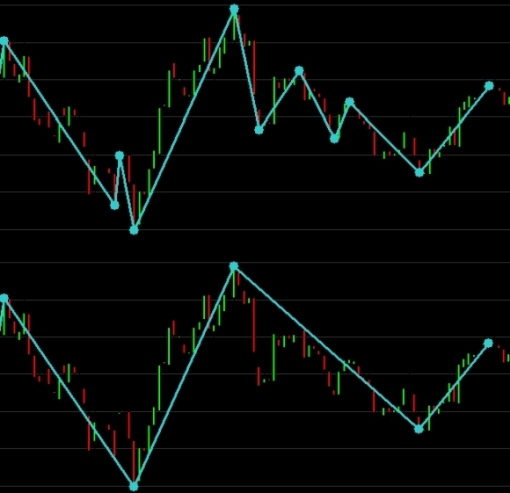
As you can see, the zig-zag really makes the significant trends much more visible. The difference between the two charts is quite obvious. While the 5 % filter shows every move that meets the requirements of at least 5 % price move in the opposite direction, the 10 % filter focuses on even more significant moves and ignores the smaller ones.
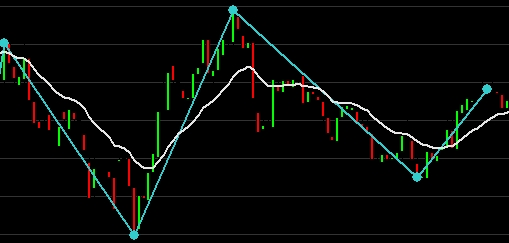
As a matter of fact – not many technical traders realize that Zig Zag is quite similar to popular moving averages. Moving averages signalize a trend change by changing the curve direction after several significant price moves. Zig Zag does exactly the same – it is just not being drawn by a curve but by a straight line (zigzag leg). See the picture below (9 % filter for Zig Zag indicator, compared to 18-day Exponential moving average).
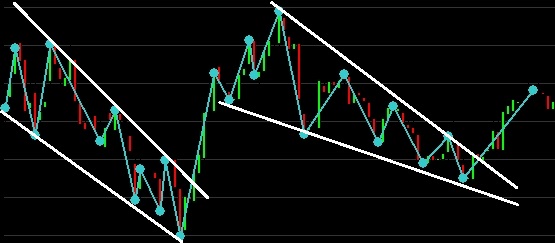
Besides, Zig Zag indicator is also very useful to identify small price swings. In such case the legs create some kind of price channels (upper and lower bands for price moves). Should asset price break these channels it could lead to nice opportunities to buy or sell the underlying asset. See the picture below (3 % filter, Close price).
How to use the indicator for technical trading:
Some traders think that Zig Zag has zero prediction ability (because its plotting is based on historical data and the line changes just after the price move is higher than the defined percentage filter). Well, it is not quite true. As it makes the trends and swings more visible, it is also much easier to identify e.g. trend lines, price channels, supports and resistances, double tops or bottoms etc. So, in combination with chart patters it can be a pretty strong trading tool.
Moreover, the prediction is also available – when you use the zigzag indicator in combination with Fibonacci retracement levels or Elliot waves.
A trader could thing that Zig Zag based on High – Low average price will be more likely to change its course (compared to Zig Zag based on Close) because the HL range is much larger and produces more swings. Although the High-Low day range is much larger, the High-Low average (which the Zig Zag calculation is in fact based on) creates much less extremes than the Close price calculations. To prove that statement, see the picture below (1 % filter).
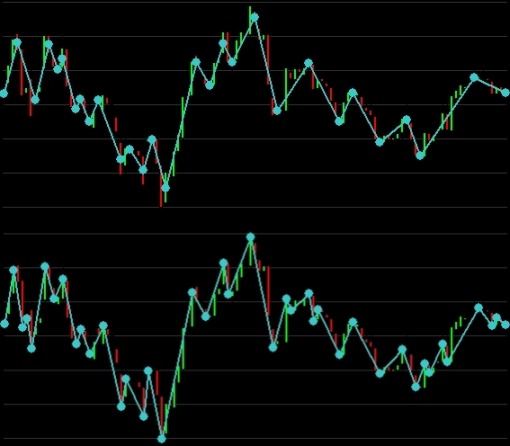
The upper image shows the indicator based on HL prices. It has created 28 legs.
The bottom image shows Zig Zag indicator based on Close prices. It has 40 legs.
The lesson resulting from this is that if a trader wants the Zig Zag indicator being more responsive to price changes he can choose the Close price. Should he want to make it more robust he would choose e.g. the HL or even OHLC average prices to calculate the zigzag swings.
