The True strength index (also known as TSI indicator) was developed by William Blau. He published it in the “Technical Analysis of Stocks and Commodities” magazine in 1991 but we also suggest you reading his book “Momentum, Direction and Divergence” (1995). TSI indicator is in fact a momentum oscillator. The basic idea that stands behind it is to show both – the strength of the current trend and the overbought (or oversold) conditions.
True strength index uses price momentum and double smoothed exponential moving average for its construction. Momentum is the difference in price between the actual price and the price x days ago. It can be a very choppy indicator, so most technical analysts try to smooth the choppiness with moving averages, in this case exponential moving average. EMA can smooth the price momentum (and is still able to react very fast to the most actual price changes) and Double EMA means that the result is smoothed again by a second moving average. The formula for TSI calculation looks like follows
Mom = Pn – Pn-x
ABS Mom = ABS (Pn – Pn-x)
EMA1 = [EMA short of (EMA long of Mom)]
EMA2 = [EMA short of (EMA long of ABS Mom)]
TSI = (EMA1 / EMA2) * 100
Pn = today's price
Pn-x = price x days ago (usually 1 day)
The Pn-x does not need to be necessary days. It could also be weeks, hours, minutes etc. It depends on the timeframe used in trading strategy. The interesting thing about TSI is that unlike other technical indicators, we do not directly determine time periods for the index calculation. We just need to set days for three basic parts of it which are: price momentum step; longer EMA of price momentum and shorter EMA of longer EMA. So, most of the settings are about exponential moving average (and they figuratively go to infinity).
TSI indicator explained
The principle of TSI indicator is not so complicated. We will use a simplified example to explain it (with Simple moving average instead of Exponential moving average). Try to imagine that we would like to calculate TSI based on a 1-day price momentum, 16-day Long moving average and 8-day Short moving average. In this example the price can either rise or fall by 2 points in every single day. If all the prices close higher, then the price momentum would look like follows.

The price has risen by +2 points every day, so the price momentum would be +2 for every one of these days. All changes are positive (above the zero line). In such case, longer moving average would equal to +2 and shorter moving average of the previous longer moving average would be +2, as well. The final TSI reading would be [(2/2) * 100] = +100 TSI points. A string of many positive price changes results in high positive readings because this signalizes strong upside momentum. The result also means that TSI value reaches its upper limit and the market is extremely overbought. Maybe we should expect some negative closings now. It applies vice versa to 16 consecutive negative days.

In such case the TSI indicator would give us result of [(-2/2) * 100] = -100 TSI points which would notify us of extremely strong downside momentum, as well as, oversold conditions on the market.
Now have a look at the next situation.
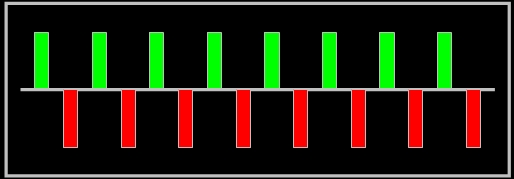
In such case the price momentum would be changing everyday from +2 to -2 points. The important thing is that the Long-time moving average of price momentum and Short-time moving average (of previous long-time moving average) would be 0. The Long-time moving average of ABS price momentum, as well as, the Short-time moving average would equal to 2. The final TSI value would be [(0/2) * 100] = 0. The zero TSI reading means that the market is in its equilibrium and neither Bulls nor Bears are winning. There is no dominant trend, the market is just moving sideways.
Another possible situation is displayed in the picture below.
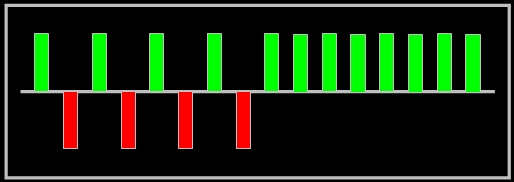
In such case, the Long-time moving average of Price momentum would equal to +1. The short-time moving average of the previous moving average would equal to +0.5 (this may look strange to you, but the short time moving average is calculated from the long-time MA and it has raised from 0 to only +1 within the last 8 days). The Long-time moving average of ABS Price momentum would equal to +2 and short-time moving average of previous moving average would be +2, as well. The final reading would be [(0.5/2) * 100] = +25 TSI points. This reading means that taking into account also the older 8 days, the asset has just became overbought (the price has suddenly got from 0 to +25 points – which is the level for overbought market).
As stated at the beginning – the explanation is a bit simplified. We have used a simple moving average to show you how it works. The original TSI indicator uses Exponential moving average. The main difference is that while in SMA has every day the same importance, in EMA the most current day has much higher importance than the oldest one.
How to set and read the indicator
Generally said a 25-day EMA is applied to the price momentum (difference between two prices), and later a 13-day EMA is applied to the result. These are the most common settings but you can choose different ones. The final TSI readings are bound by -100 and +100 boundaries. Readings near these limits are very rare, but the shorter time periods you use for EMA in TSI calculation, the sooner you reach the extremes. Most values move between -25 and +25 limits, which Blau also suggested to use as oversold and overbought levels. This is exactly the part where TSI indicator behaves as oscillators do (RSI, W%R, CCI, Stochastic, etc.). On the other side, the overall trend direction is determined by the slope of the curve. If the curve rises, it means an UP trend. If it falls, it means a DOWN trend. The rising value of TSI means that the price momentum gets stronger in the direction of the price move.
It applies that the indicator is negative when the double smoothed price momentum is negative and positive when it is positive. The double smoothed ABS price momentum normalizes the indicator and sets the upper and lower limits for oscillator (+100 and -100). In other words, this indicator measures the double smoothed price momentum relative to the double smoothed ABS price momentum.
Below you can see the TSI indicator displayed in a chart. It is set to 1-day price momentum, 10-day longer moving average and 5-day shorter moving average. There are also arrows that point out to the spots where it crosses the oversold and overbought levels back into the normal range.
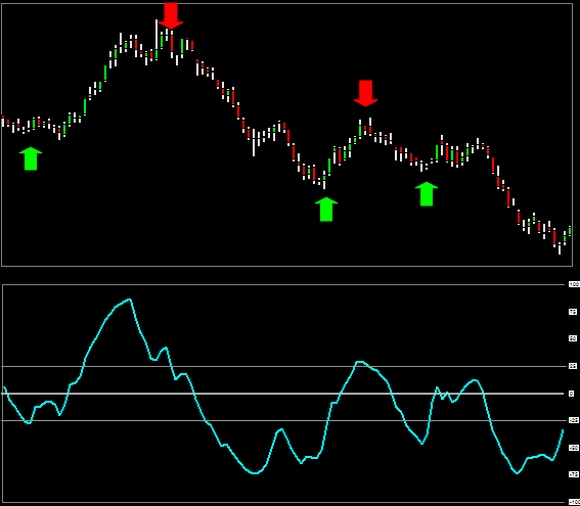
As you can see, the TSI generates really nice bullish and bearish signals. It worked really well for most of the time but did not catch the last downtrend. That is the reason why every trader should use Stop loss orders. The nice thing about every indicator is that once you have it in Excel file, you can change almost anything and experiment with the settings. In the next image we have kept the moving averages settings and changed just the price momentum (from 1-day difference to 1-week difference – e.g. how much has the price changed from Monday to Monday). Have a look at the result.
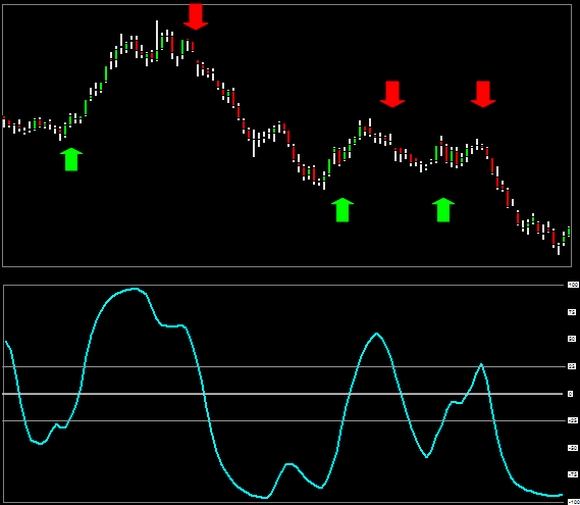
As you can see, the indicator has become much smoother. It generates signals that are slightly later but it also did catch the last downtrend.
How to use the TSI indicator for technical trading
As with most momentum oscillators, technical traders can derive signals from overbought or oversold levels, signal line crossovers, zero-line crossovers and bullish or bearish divergences. The main trading strategies are listed below.
- Alike the RSI, the indicator signalizes the oversold and overbought market conditions. The level of +25 points signalizes an overbought market, while the level of -25 points signalizes an oversold market. But please take into account that overbought and oversold conditions are not necessary signals of impending trend reversal. They simply suggest that prices have come too far, too fast. Technical traders should wait for a confirming signal to suggest an actual reversal.
- Crossing the zero-line UP means that the market has just turned bullish (a trader should go long). Crossing it DOWN means that it has turned bearish (and it is time to sell the asset).
- Traders can also pay attention to the TSI and its EMA crossings. Signal line crossovers are by far the most common signals. Crossing the Signal line down means that bullish momentum is weakening and maybe there is a time to sell the asset. Crossing the Signal line up means that bearish momentum is weakening and there is a time to buy. Traders do get the entry end exit signals sooner than by waiting for crossing the zero-line. EMA is usually set to 7 days but the fewer days we use for its calculation the more signals we get and vice versa. By using this trading strategy the analysts are getting closer to using the index as a counter-trend oscillator (please take into account that the trend can persist for a very long time even on weakening momentum).
- Next strategy is to trade the bullish and bearish divergences. They can alert us of a possible trend reversal. Bullish (or positive) divergences are created when the price chart makes lower lows but TSI graph creates higher lows. This could signalize a proper time for buying an asset. Bearish (or negative) divergences are when price chart creates higher highs but TSI curve does not (a proper time to sell the asset). Analysts can also search for other chart patterns (trend lines, resistances etc.). The chart patterns have the same effect on the TSI indicator as they would have on standard price chart (because TSI consists of moving averages which are in fact smoothed prices).
Finally we would like to compare TSI with one of the most famous oscillators, which is RSI (Relative strength index). The settings were chosen deliberately to get as similar entry and exit signals as possible. Relative strength index is set to usual 14 days and the True strength index was left to the previously used settings, i.e. 1-day momentum, 10-day longer EMA and 5-day shorter EMA. The TSI is displayed by a blue curve while the RSI is plotted by a violet curve.
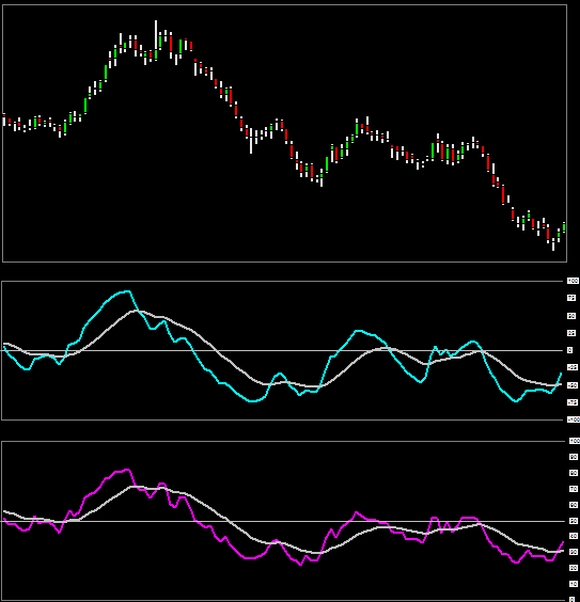
As you might noticed, the TSI is considerably smoother compared to RSI. When combined with its own 14-day EMA (as the signal line, white curve) it produces fewer false signals. That may be the reason why so many technical traders prefer TSI indicator before the RSI oscillator.
If you are interested in a deeper study of this technical indicator, this section may be of interest to you. There you can find all available indicators in Excel files for download.
