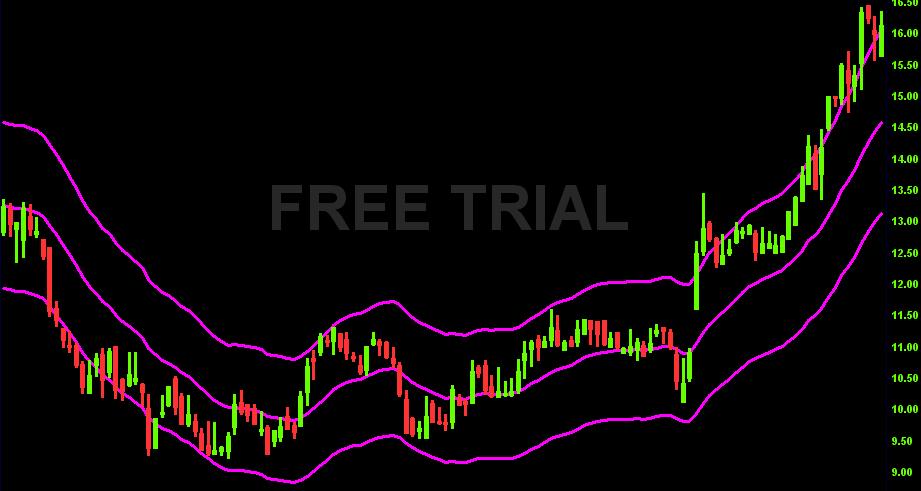
Envelopes are an easy indicator to use. It consists of two moving averages, or we can also say of two variations of one moving average.
Its calculation is as follows:
Upper envelope = EMAx + y %
Lower envelope = EMAx – y %
EMAx = selected moving average
y % = optional percentage of Envelope width
Both - Upper and Lower Enverope do copy the moving average in the distance the trader chosed. E.g. if EMA21 was 10 poinst and the optional percentage of Envelopes width is 5 %, then the upper Envelope would be 10.5 and lower Envelope 9.5 points.

Copyright © Picture made by Incredible charts
How to use the Envelopes:
Should the market be trending, the price doesn't move in whole of the Envelope's range. In such case it mostly moves either in the upper range (from the EMA to the Upper Envelope) - if there is an Uptrend, or in the lower range (from the Lower Envelope to the EMA) - if the Downtrend prevails. In such case, should the price fall down from its Upper Envelope to its EMA, we buy (that is for the Uptrend). Should the price rise up from the Lower Envelope to its EMA, we go Short.
MA Envelopes are quite similar to Bollinger Bands. The difference is that BB take into consideration the market volatility, but the price Envelopes are allways in the same range from the Moving average. The market volatility is not taken into consideration during their construction. That is the reason why it's quite appropriate to modify the Envelopes width during higher market volatility.
If you are interested in a deeper study of this technical indicator and prefer ready to serve solutions, this section may be of interest to you. There you can find all the available indicators in Excel file for download.
