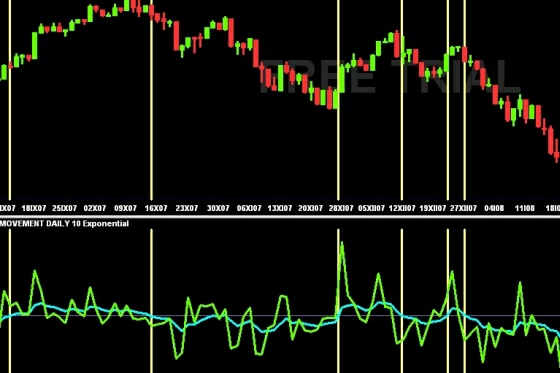
Ease of Movement indicator was created by Richard W. Arms, Jr.. As the title says, its aim is to assess "easiness" by which the asset price is changing. It takes into consideration not just the prices but also the volume of trades that have been at those prices realized.
Ease of Movement reaches high values in case the asset prices rise very fast and the Volume is low. On the contrary, low EOM values mean that the prices fall very easy at low Volume. If the prices are steady, or high Volume is needed to move them up or down, the indicator values oscillate around the Zero line.
Ease of movement formula is as follows:
EOM = [(H – L) / 2] – [(H n-1 – L n-1) / 2] / [(Volume / 10000) / (H – L)]
The Volume is divided by a high number (usually 10000), so it is easier to work with the result. Every trader can adapt the number according to the Volume that is mostly reached at the market he trades.
There is Ease of Movement displayed on the picture bellow. Yellow vertical lines point out to the moments when Ease of Movement's Moving Average crosses the Zero line either upwards or downwards.

Copyright © Picture made by Incredible Charts
How to use it:
It's quite usual to combine the EOM with its Moving Average – usually 10-days EMA. Crossing above the EMA mean a signal to Buy and vice versa.
