Force Index was created by Alexander Elder. He described this indicator in the "Trading for a Living", 1993. Force index calculation is based on the price, as well as the volume of the asset. Its aim is to reveal prevailing forces on the market - either positive or negative.
Force index belongs to oscillators. It reminds Histogram by its shape. Its values oscillate around the zero line and the minimal and maximal values are not limited.
Force index formula:
Force Index = (Close n – Close n-1) * Volume
Close n = today's close
Close n-1 = yesterday's close
As you can see from the formula above, Force index focuses on revealing the positive and negative forces on the market. If today's Close is higher than yesterday's, the Force is positive. Should it close lower, the Force would be negative. Besides, it is multiplied by the Volume that was traded. Because the Force index changes itself very often, it is common to use a moving average for its smoothing. It is recommended to use EMA2 for smoothing short-term and EMA13 to smoothe middle-term Force index.

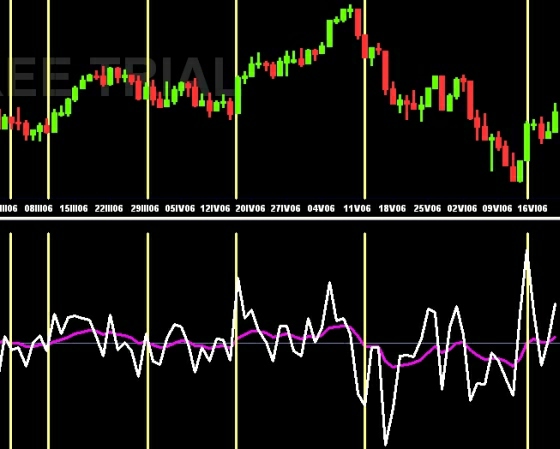
Copyright © Picture made by Incredible Charts
There is a Force index, smoothed by EMA13 on the picture above. The yellow vertical lines mark places where EMA13 crossed the zero line upwards and downwards.
How to use the Force index:
- A. Elder recommends Buying when the short-term Force index is negative and Selling when it is positive. All trades should be in accordance with middle-term EMA (e.g. EMA13). If EMA13 is rising, we wait for negative short-term Force index and Buy then. The analogy for EMA13 falling while Force index positive.
- If middle-term Force index crosses the zero line upwards, it means the Bulls are stronger than the Bears, so it is better to go Long. Should it crosses downwards, the Bears are more powerful and it's better to go Short.
- You can use positive and negative divergeces between price graph and the middle-term Force index, too.
A. Elder himself uses the Force index as a part of his Triple Screen System.
