TEMA is an abbreviation of Triple Exponential Moving Average. This technical indicator has been developed by Patrick Mulloy and first published in 1994 in Technical Analysis of Stocks & Commodities (paper called “Smoothing Data with Faster Moving Averages”). TEMA provides better price averaging and responds faster to any price swings. It can filter out many minor price fluctuations (price volatility) so it is much easier to identify the dominant trend. What makes TEMA indicator so efficient is that on one side, it uses several smoothed EMA (which makes the TEMA curve smooth enough) but on the other side, the formula also includes an adjustment for de-lagging behind the price. It is considered to be a trend indicator.
The formula for TEMA calculation looks as follows:
3. Calculate the EMA of the previous EMA (3rd EMA).
4. The TEMA formula: [3 x (1st EMA)] – [3 x (2nd EMA)] + (3rd EMA)
Triple Exponential Moving Average and the standard Exponential Moving Average in a comparison:
TEMA calculation eliminates the lag and the final result is an exponential moving average that follows the price of underlying asset much closer. See the image below.
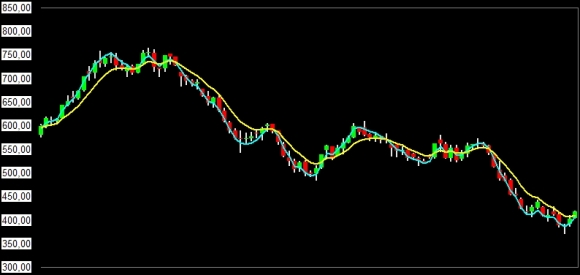
TEMA was set to 7 days period for 1st EMA, 2nd EMA and 3rd EMA and is displayed by the blue curve. As you can see, TEMA is following the candlestick chart very closely (actually it is very similar to ZLEMA curve). Moreover, we have added Exponential moving average, also set to 7 days, into the chart, so you can compare the averages and see the difference (EMA is represented by the yellow curve).
All the next tests and comparisons have also proven that TEMA reacts better than the more popular EMA does. When comparing the curves, it applies that TEMA set to 100 days is similar to approx. EMA set to 34 days. See the image below.
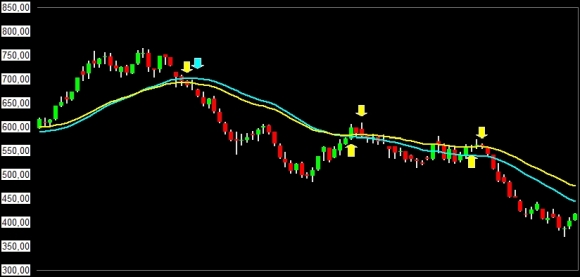
EMA again is displayed by the yellow curve (so are the EMA trading signals) while TEMA is displayed by the blue curve (so is the only TEMA signal to sell). So, when trying to compare as similar curves as possible – despite the fact that EMA and TEMA are very similar, TEMA generates less false trading signals and is better for identifying the overall price trend.
When comparing TEMA and EMA set to the same period (in this case 100 days) – the EMA curve is more lagging and the important thing is that the EMA signal to sell is also given some days latter.
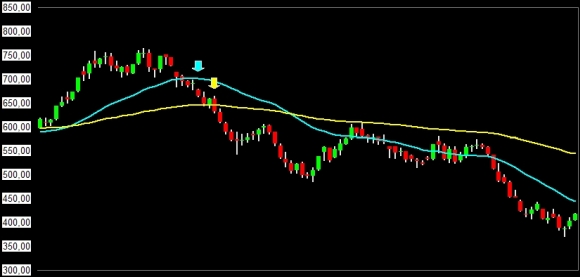
Maybe you are thinking about setting EMA some days less than TEMA indicator (e.g. TEMA set to 100 days and EMA set to 90 days). Yes, we have tried this but did not get any better signals. EMA once again has generated more signals (which would lead to higher number of unprofitable trades) and, at the same time, it did not act any sooner. Please, see the image below.
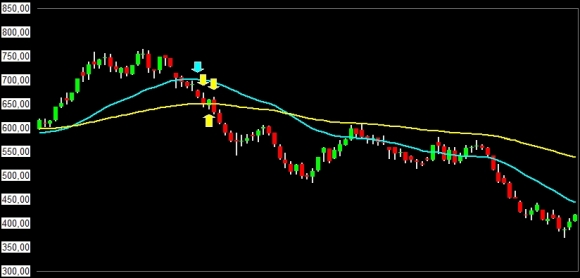
As a conclusion – the comparisons and tests have shown that TEMA is significantly better technical indicator than EMA is. TEMA reacts sooner and is much better for defining dominant trend in the market so it can definitely be used as a trend indicator (instead of Simple moving average or Exponential moving average). It would also be very interesting to include TEMA in some other technical indicators which are currently based on SMA and EMA calculations – e.g. Bollinger Bands, MACD or even Schaff Trend Cycle etc. because the signals from such indicator could also be a bit faster and more reliable.
How to use this indicator of technical analysis to create a trading strategy?
- You can use it as any other moving average (ZLEMA, FRAMA, KAMA, Hull moving average, T3 etc.). It shows the dominant trend in the market so, if you use any other technical indicator or trading signals, you can enter just trades that are in line with the TEMA trend.
- You can use TEMA solely and buy when its values begin to rise and sell when its values start to fall, or you can search for crossings of TEMA and any other moving average.
- Because TEMA gives us smoother curve than Close prices do, the chart patterns become more visible - so you can search for them (supports or resistances, double tops or bottoms etc.).
As with almost all of the technical indicators the best thing every trader can do is to test his own data, his own settings, and his own rules how to trade. Surprisingly, sometimes the best result can be achieved with settings that are not common and rules that are quite strange at a first glance – the more things a trader can change and experiment with the better for him and his trading strategy.
