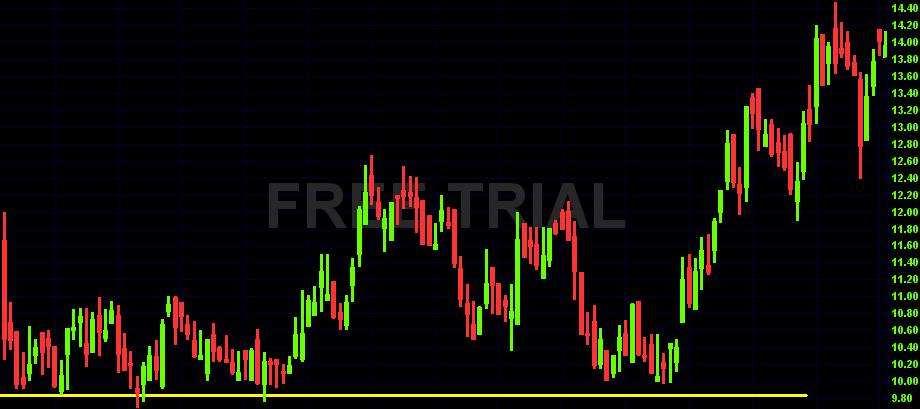
Support is a strong trading tool of technical analysis. It is based on a number of bottoms that are formed at the same level. In other words the Lows just refuse to sink even lower.
Psychologically it can be described as a price level below which traders refuse to Sell. Such Support price becomes a very strong pattern and predicts a possible trend reversal. In the case of Support it's a reversion from a Downtrend to an Uptrend.

Copyright © Picture made by Incredible Charts
How to use the Support:
We go Long just after the price bounced from the bottom and the pattern has been formed. Stop Loss can be placed few ticks below the Support line, but not too close. Support is not exactly given price, it oscillates in a narrow range instead, so the SL should be placed below the range, not within it.
Note: Beware of strong Supports breakthroughs. Should the price break through a strong support, then a lot of traders would change their positions to the opposite ones. In such case the price continues to fall and the decrease is steep enough. The previous Support becomes so a new Resistance.
Resistance
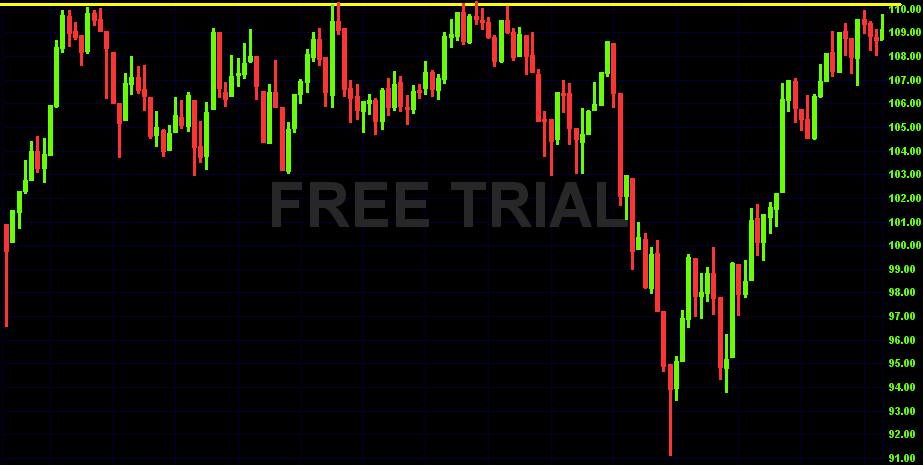
Resistance is an opposite to the Support. While Support forms itself below the price chart, Resistance forms above the price. It consists of several tops, that the price reached couple of times before, but had never overcomed.
Psychological reasons: It is a price above which traders refuse to Buy (they aren't willing to accept any higher price). The asset becomes overbought near the Resistance level. The price at which the Resistance is formed predicts a possible trend reversal - from an Uptrend to a Downtrend, in this case.

Copyright © Picture made by Incredible Charts
How to use the Resistance:
We sell after the price bounces back from the top and the Pattern forms, not any sooner. Stop Loss can be placed several ticks above the top - above Resistance. We shouldn't place the SL too near the Resistance. The pattern forms within a narrow range, it is not a specific number, so think of it when placing Stop Loss.
Note: The same rules as for Support applies here. Beware of the Resistance breakthroughs. Then the opposite reaction of market can be expected - a stormy increase. In the case of a breakthrough traders change their positions to the opposite ones, to lessen their losses. It means the price continues to rise and the previous Resistance becomes so a new Support.
