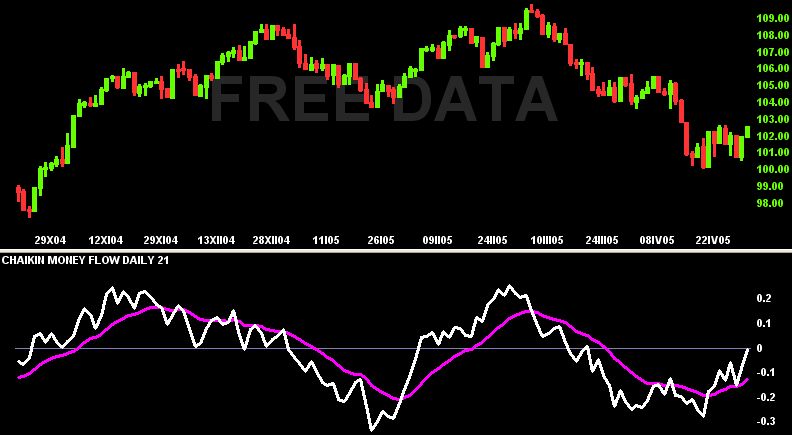
Chaikin Money Flow – CMF was created by Marc Chaikin.
CMF compares the whole Volume with regard to the Close, High and Low prices. Its use is based on the assumption that the potential rising asset would have Close price near the High and rising Volume. On the other hand the potential decreasing asset would have Close near the daily Low in combination with high Volume.
CMF formula:
1. CLV = [(C – L) – (H – C)] / (H – L)
2. CMF = ∑ (CLV * Volume) / ∑ Volume

Copyright © Picture made by Incredible Charts
As you can see from the picture above, the CMF generated quite good signals at the moments it crossed its 13-days EMA. Recommended setting for CLV calculation is 21 days (∑ CLV).
Every trader should answer 3 basic questions to evaluate the CMF:
- Is the CMF above or below zero line?
- How far is it from the zero line? 0,1/-0,1 can be considered being quite strong signal to buy or sell.
- How long is it above/below the zero line? The longer time has passed, the stronger the signal is.
How to use the indicator:
If the CMF is above the + 0.25 level, it's a signal to Buy. If it is under – 0.25, it is better to enter a Short trade. If the CMF values are below the zero line, while the price is rising, it is considered to be a signal of a reverse comming soon.
The opposite is true, should the price fall, while the CMF values were above the zero line.
In general we can say, the longer the CMF is under the zero line, the more preasure to sell rises and vice versa.
Note: Despite the positive and negative divergences aren't standard part of this indicator, they can be a strong trading tool, as well.
