
Chande Momentum Oscillator (also known as CMO indicator) was developed by Tushar S. Chande – a well known technical analyst and futures markets trader and the author of ‘Beyond technical analysis’ book. The CMO indicator has been described first in another widely acclaimed book ‘The new Technical Trader’ (Tushar S. Chande and Stanley Kroll, year 1994).
CMO is similar to other momentum oscillators (e.g. RSI or Stochastics). Alike RSI oscillator, the CMO values move in the range from -100 to +100 points and its aim is to detect the overbought and oversold market conditions. Unlike the RSI oscillator, CMO calculates the price momentum on both – the up days as well as the down days. The CMO calculation is based on non-smoothed price values meaning that it can reach its extremes more frequently and the short-time swings are more visible.
CMO indicator calculation/formula looks like follows:
1. Should today's Close (Close n) be higher than yesterday's (Close n-1), then
CMO1 = Close n – Close n-1
CMO2 = 0
2. Should today's Close be lower then yesterday's, then
CMO1 = 0
CMO2 = Close n-1 – Close n
3. Sum up all the CMO1 and CMO2 values for certain period of time (e.g. 10 days)
4. CMO = 100 x [(CMO1 – CMO2) / (CMO1 + CMO2)]
So, as you might already noticed, this technical indicator calculates the difference between the sum of all recent gains and the sum of all recent losses. The result is divided by the sum of all price movements over the period and multiplied by 100 (to get the -100 to +100 boundaries). The most used periods for summing up the values are usually in the range between 9 and 20 days. Should the price raise constantly, day by day, the CMO value would equal to +100. Should it fall constantly, the CMO reading would be -100. But such situation would be extremely rare and it is more than likely that Chande momentum oscillator readings would move closer to the 0 line which is the equilibrium point.
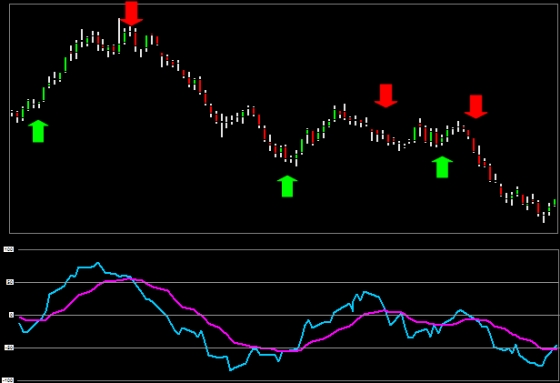
There is many ways how to set and use the indicator for technical trading. Please have a look at the picture below. It displays CMO indicator (set to 15 days) and its Exponential moving average (15 days, too). As you can see it generates nice trading signals to go short or long. The shorter period you choose (either for the CMO or its EMA) the more signals you get and vice versa. The right settings are also very dependant on volatility of the market (e.g. Forex is much more volatile than Stock market).
How to use the CMO indicator for technical trading:
• If the current CMO value is above +50, the underlying asset is considered to be overbought. If the value is under -50, it is considered to be oversold. When the asset price crosses these limits from the extremes to the middle range, a trader should sell (in the first case) or buy (in the second case). The values +50/-50 are similar to RSI’s 70/30 signal lines or Stochastic’s 80/20 limits.
• Crossing the 0 line above could also be a bullish signal while crossing the line below would be bearish.
• Technical traders also follow the crossings of indicator values and their moving average (in such case the moving average becomes the signal line – instead of the +50/-50 bands or the 0 line). If the CMO indicator crosses its moving average upwards, it would be a signal to go Long. Should it cross its moving average downwards, a signal to go Short would be given so. The most common moving average is the Simple moving average. In the picture above we have used Exponential moving average, which is much better in our opinion. The other moving averages that could be tested with the CMO indicator are e.g. KAMA, FRAMA, ZLEMA, Hull moving average etc.
• Short-time and Long-time CMO crossings can be also used to generate the buy and sell signals.
• CMO (alike the VHF indicator) can also be used to determine how much is the price trending. High values of CMO indicate not just overbought conditions but also a significant trend. In such case it would not be the best idea to go short. Instead, a trader should wait first for a signal that the trend is broken (indicator value falls below e.g. the +50 line) or take just trades that are in line with the current trend. On the other side, the lower the CMO values are (close to 0 line), the higher probability that the market is choppy and moving sideways. So, if a trader uses trend-following system, he should enter trades when the CMO values are approaching their extremes and exit them when the values approach to the middle range.
• Similar to other momentum oscillators, it is possible to use the CMO divergences with the price chart (this option is not directly mentioned by Tushar S. Chande in his book). Moreover, you can search for various technical patterns created by the indicator chart, as well.