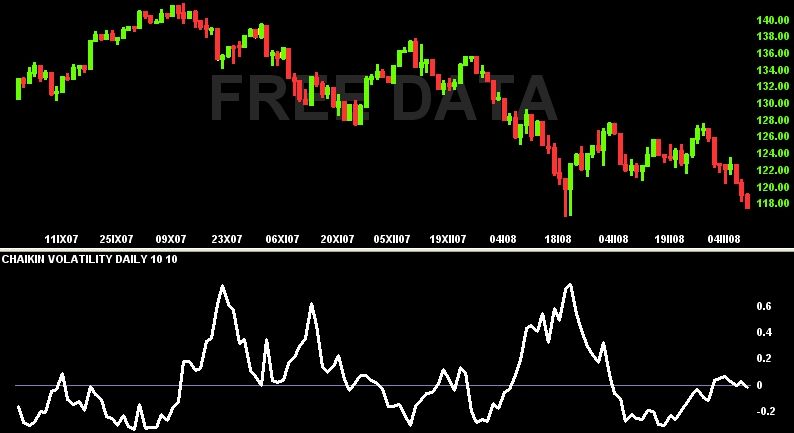
Chaikin Volatility was created by Marc Chaikin to measure the volatility. The volatility is defined as a rising difference between High and Low of the asset price, according to the M. Chaikin
The formula for Chaikin Volatility looks like follows:
ChV = (EMA HL – EMA HL n days ago) / (EMA HL n days ago * 100)
Technique of construction:
- Compute the differences High – Low
- Compute short EMA (e.g. EMA10) based on the differences High – Low
- Compute the percentual change (Rate of Change) for a chosen period of time, i.e. (actual EMA – EMA n periods ago) / EMA n periods ago * 100. In this example n = 10 days ago.

Copyright © Picture made by Incredible Charts
How to use the indicator:
- Increase of volatility during relatively short time period can point out that the bottom is shortly to come and trend reversal is to be expected. Decrease of volatility during a longer time period can point out that the top is near enought and trend change is shortly to come.
- Next ways of using the indicator are based on the assumptions that the market Tops are followed by stormy increase of volatility, as the investors became more nervous and less decisive. The ends of market bottoms go along with low volatility.
The use of Chaikin Volitility indicator is in more variations, while none of them has rules that are clear enough. That's the reason why this indicator has its use especially in Personal Trading Systems - OOS. In such Trading systems the trader can create the rules himself, according to the nature of the particular indicators he uses. There are no clear rules to enter and exit the trade, so the Chaikin Volatility can serve like another small aid for trading.
It is also recommended to use the Chaikin Volatility in conjuction with Moving averages or Price envelopes.
