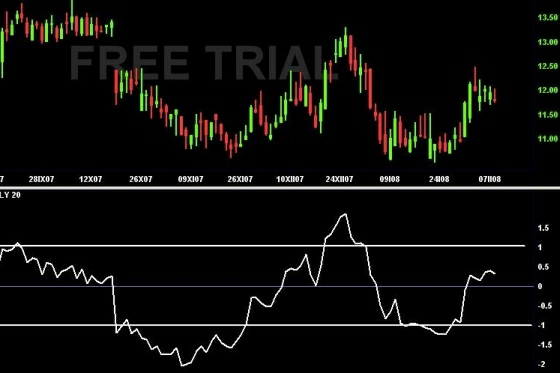
Detrended Price Oscillator was created with the aim to help traders identify basic short-term market cycles.
DPO is another version of moving average. While the MA is set to rise or fall according to price graph, DPO oscillates around the horizontal zero line. The prevailing trend is eliminated, so the market cycles can be specified much better.
Thanks to its graphic form the moments of oversold/overbought conditions can be identified easy enough. That's how the DPO makes use of the periodic cycles.
The construction od Detrended price oscillator is quite simple:
Choose the time period you want to analyze first - e. g. 20 days.
Set the "n" parameter as half of the period (i. e. 10 days in this case) and add 1. It means 11.
DPO = Close [(n/2)+1] – SMAn
Close [(n/2)+1] = Close price (n/2)+1 days ago.
Should we decide to analyze 20-days period, then the Simple Moving Average would be 20-days SMA
Example: If Close price 11 days ago was e.g. 100$ and SMA is 90$, then DPO = 100 - 90 = 10.
The cycles that are longer than the DPO settings are eliminated.

Copyright © Picture made by Incredible Charts
How to use DPO for trading:
- Ranging market (market moves sideways): When DPO falls and then rises above the oversold level, we Buy. If it rises above and then falls below the overbought level, we Sell. The Overbought and Oversold levels are set according to our past market observations and historical tests. The DPO is not bounded by any -100 to 100 levels so it can reach any arbitrary values.
- Trending market: We Buy and Sell allways in the market direction. We enter the Long trade when the DPO rises above the Zero line and we enter the Short trade when it crosses the Zero line downwards. We enter the trades just in case the trend is clear, i.e. todays Close does not end below or above the selected Moving Average. Otherwise it could mean a trend reversal.
- Positive and Negative divergences. If DPO makes new Higher Low, while price graph new Lower Low the positive divergence has been created). It means we Buy. If DPO makes Lower High and price chart makes Higher High, we sell, cause the Negative Divergence has just been formed.
