ATR is a common abbreviation of Average True Range indicator. ATR has been developed by a famous trader J. Welles Wilder in 1978 and described in his book New concepts in technical trading systems. It was used especially for commodity trading because commodities are much more unstable and volatile than stocks are. Nowadays it is still commonly used on dynamically changing markets like Futures or Forex market. Stock traders usually use other volatility indicators – e. g. Standard deviation.
The important thing is that ATR does not indicate the direction of price, neither it indicates exact buy or sell signals. ATR simply determines the value of a common price range. The more volatile the market is, the higher ATR value we get and vice versa. It is mostly used to compute other indicators of technical analysis - like ADX or RSI or to obtain detachment of the market as a whole. Moreover it is also used to estimate the appropriate Stop Loss level to minimize the trading losses. The formula for ATR calculation looks as follows:
1. Find the highest number from these ones:
Today's High – Today's Low
ABS (Today's High – Yesterday's Close)
ABS (Today's Low – Yesterday's Close)
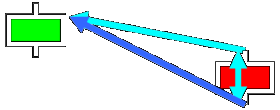
Look at the picture below to see what we compare.

The highest number from the previous ones is the “True Range”. As you might notice, the True range is not based solely on the intra-day High-Low range because it could not capture the inter-day changes - especially gaps and price jumps during limit moves. In most cases the True range equals to High – Low difference, but if yesterday’s Close is out of this range, then True range extends to this price.

To get the “Average True range” we need to average the values for a chosen time period.
2. ATR = {Today’s TR + [Yesterday’s TR * (n-1)-days]} / (n-days)
The ATR indicator is mostly calculated as 14-day moving average (n = 14). This period is just default but not constant value. Its change to higher or lower period is up to the trader, his preferences as well as the market volatility and time periods he trades.
For example in very volatile times the change to 7-day ATR (which means 7-day moving average of the True range values) can react faster and a trader can make his decisions sooner. On the other side should he use 7-day ATR when the market is quiet enough, he could get many false signals. Once again – ATR is not any directional indicator with buy or sell signals, but it is being used for other indicators’ calculation – so more volatile ATR would also mean more volatile values of the dependent indicator. It applies generally that longer ATR timeframes will likely lead to fewer trading signals, while shorter timeframes will likely increase trading activity.
You can see the difference between basic TR (true range) values and ATR (average true range) values in the picture below:

The red curve stands for the ATR values while the green one stands for original True range values. This applies to 7-day ATR. The more days you choose for ATR calculation, the smoother curve you will get.
Despite the fact that 14-day ATR takes into account last 14 true range values, it does not necessary mean that it is always 14 days. It depends on the timeframe which a trader uses for his trading. E. g. the classic 14-day period for ATR averaging is in fact 3.5 hours, if he trades on 15-minute timeframes (14 x 15 min = 3.5 hour). So a more appropriate name for 14-day ATR would be 14-period ATR (as not all traders use just 1-day timeframes).
Please notice, that you can not simply compare ATR of two (or more) different assets. As stocks, commodities etc. have different prices, ATR of a commodity with price around 500 cents would reach much higher values than a commodity with price around 10 cents. If you would like to compare ATR of more different assets, you should first get comparable values – which means convert the ATR values to percents. It can be done for example by dividing the today’s ATR value by the average Close price within the chosen period of time.
How to use this technical indicator:
- ATR is commonly used in Stop loss calculations. The lower the ATR values are, the quieter the market is and the closer the Stop loss price can be set.
- Traders are also watching closely the ATR values. In times when the market moves sideways, the ATR values use to be low. In such case choosing counter-trend oscillators (Stochastics, RSI, W%R etc.) can be a good choice.
- Watch for breaking strong chart patterns (e. g. supports and resistances). Should they be accompanied by an increase in ATR values it would mean that such break has been confirmed and many traders close their positions on Stop loss prices or enter new trades in line with the recent break.
