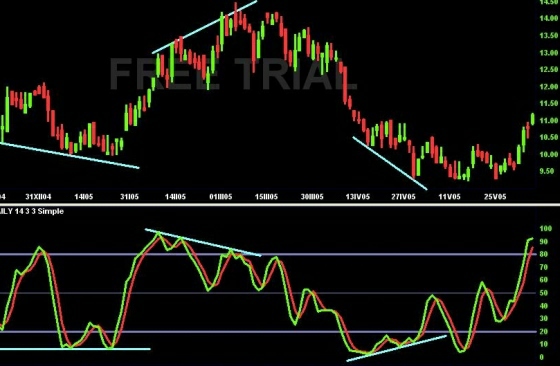
Stochastic Oscillators were created by George Lane in the middle of 20th century. Generally said, Stochastic, alike the W%R and RSI indicators indicates the oversold and overbought markets. There are 2 basic types of Stochastic Oscillators.
- Fast Stochastic
- Slow Stochastic
Stochastic calculation/formula looks like follows:
%K = [(Close – Low n)/(High n – Low n)]*100
Low n = Is the Lowest Low within n periods
High n = Is the Highest High within n periods
%D = is the moving average of %K
The most common setting of the moving average (%D) is to 3 days.
By calculating these two curves - %K and %D we get so-called Fast Stochastic Oscillator.
Now we describe the more complicated step of construction:
In the next calculation the %D Fast Stochastic is simultaneously the %K Slow Stochastic. In other words, the smoothed curve from FSTO calculation is the initial curve for SSTO. If we smooth the %D of FSTO (%K of SSTO), we get %D for SSTO. In other words Slow Stochastic just consists of another smoothing.
Most common settings of Stochastic Oscillator are to 5, 14 and 21 time periods. The settings depend on the fact whether we prefer to get every small price swing signal or just signals about main trend reversals. By increasing the period, we get less signals that indicate just more important trend changes.
SSTO can be plotted in the chart. Its values move in the range of 0 to 100. The lines of 20 and 80 points are considered to be the Signal lines.

Copyright © Picture made by Incredible Charts
As you maybe realized, the Stochastic is based on following and comparing the Close price position to the High/Low range within the chosen time period. If Close gets near its Low, the bottom is near and a trend reversal can be expected. The oposite is true for the price getting near its High.
The greatest danger for momentum oscillators is the trending market. It can keep FSTO/SSTO values above or below the signal lines for a long time. Meanwhile it can generate some false signals to Buy or Sell. It is important to analyze the market conditions and do not enter countertrend trades while there is a strong trend present on the market.
How to use the Stochastic oscillators:
If the FSTO/SSTO value is below 20 points, the asset is considered to be oversold and its price will probably rise. If the value is above 80 points, the market is overbought. Some of the traders use the %K and its crossings with the signal lines 20/80. Such trading can generate many false signals. %D generates less signals, but they are more reliable.
Other Buy and Sell signals are generated by %K and %D crossings. In other words the signal is generated by the %K pure curve crossing with its (usually 3-day) moving average. Such crossings are more reliable should they happen in the oversold and overbough levels. Signals generated in the middle range between the Signal lines is not reliable enough.
The most common and reliable use of Stochastic indicator looks like follows. We Buy if %K crosses %D (using FSTO or SSTO) upwards. Such crossing needs to be done under the 20 points level and both curves have to break through the signal line upwards then. We Sell at the opposite condition, with the signal line set at 80 points.
You can see how to use the FSTO indicator to generate nice Buy and Sell signals in the picture below. The signals are given by %K and %D crossings above and below the signal lines.

Copyright © Picture made by Incredible Charts
And of course, you can also trade the positive and negative divergences.
In the end: It is best to leave the technical indicator settings to every trader himself. He alone should decide about the Signal line positioning, Moving average smoothing, Calculation periods choosing etc.
If you are interested in a deeper study of this technical indicator and prefer ready to serve solutions, this section may be of interest to you. There you can find all the available indicators in Excel file for download.
