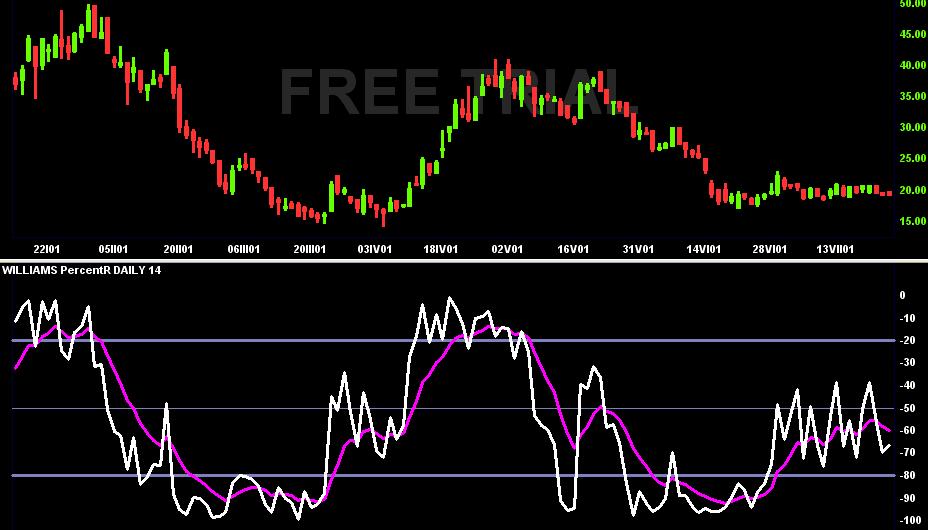
Williams Percentage Range is an indicator of technical analysis. It was created by Larry Williams (he proved to raise his accout from 10,000 USD to 1,1 Million within 1 year).
Williams Percentage Range belongs to Momentum oscillators. It is very similar to RSI and Stochastic so it shouldn't be used in conjuction with them only. All the indicators helps us to identify the oversold and overbought levels and the proper entry points.
W%R formula/calculation looks like follows:
(Highest HIGH within n periods – today's CLOSE / Highest HIGH within n periods – Lowest LOW within n periods) * (-100)
Recommended settings of W%R are to 14 or 28 time periods. If we trade 1-hour periods than it equals to 14 hours then.
Indicator values move in the range of 0 to minus 100.

Copyright © Picture made by Incredible Charts
Values below minus 80 mean, that the asset is oversold and its value will probably rise. Values above - 20 mean that the asset is overbought and its value will probably fall.
Such indicator settings are quite unusual. Most technical indicators are set to opposite values (overbought level is above 80 points and vice versa). That is the reason why we can also find W%R adjusted to the common perception of values. It is good to check first what indicator settings are used in the analytical programmes we work with.
An interesting feature of W%R is that it can predict price reversals in advance. On the other hand it can also happen that it points out to the oversold/overbought conditions, but the trend continues in its direction further. Some of the technical analytics prefer to use W%R with the settings to -50 points upwards/downwards. It means they do not take into consideration the recommended -80/-20 values.
As the W%R curve is quite volatile, we can smooth it by a moving average to get signals that are much more clear.
If you are interested in a deeper study of this technical indicator and prefer ready to serve solutions, this section may be of interest to you. There you can find all the available indicators in Excel file for download.
