ZLEMA is an abbreviation of Zero Lag Exponential Moving Average. It was developed by John Ehlers and Rick Way. ZLEMA is a kind of Exponential moving average but its main idea is to eliminate the lag arising from the very nature of the moving averages and other trend following indicators. As it follows the price closer, it also provides better price averaging and responds better to price swings.
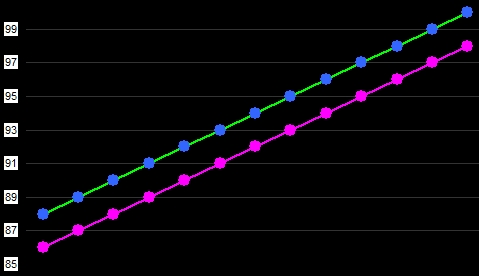
Example: just try to imagine a straight line of data – it can happen when asset prices are rising or falling constantly. If a trader uses a classic EMA (exponential moving average), he would find out that the EMA equals to the asset’s Close price [(n-1)/2] days ago. In other words – for 5-days EMA calculation, the current EMA value would be the same as the Close price [(n-1)/2] = 2 days ago. You can see the result in the image below.

As you might already noticed, ZLEMA values look different. There is no difference between the values and Close prices. The equations (formula) for ZLEMA calculation look as follows:
Lag: [(n day’s period – 1) / 2]
Entry data for EMA: [Close + (Close – Close of the lag day ago)]
ZLEMA = EMA of (Entry data for EMA)
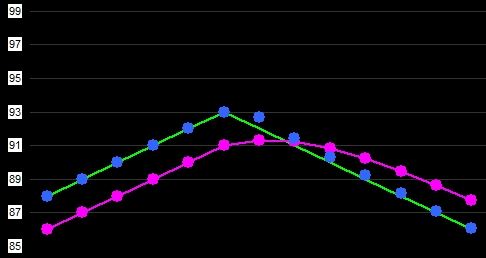
The calculation eliminates the unwanted lag and the final result is an exponential moving average that follows the asset prices much closer. Should the prices be a straight line then the ZLEMA would be the same straight line. See the image below.

The pink line and points represent EMA values.
As you can see, when the prices create a straight line, the ZLEMA values are exactly the same as the prices are. There is no lag, no difference. ZLEMA simply reacts much faster than the EMA does. Interesting enough, isn’t it?
And what happens if prices change rapidly? Look at the image below. You can see again that it takes some time for the EMA to adapt to the changing conditions in the market. On the other side, ZLEMA can adapt almost at the same time when the change of price trend happens. It is because the ZLEMA calculation is being made on a de-lagged data, instead of the regular ones. The current prices are overweighted and the more we go to the past the data are more underweighted - ZLEMA removes the lag by doubling the price increase or decrease between [n] and [(n-1)/2] days to minimize the cumulative effect.

How to use this technical analysis indicator for trading?
- You can use it as any other moving average (FRAMA, KAMA, HMA, T3, Vidya, DEMA, VAMA etc.). It shows the prevailing trends in the market so you can enter trades that are in line with the current trend.
- You can combine the ZLEMA with any other moving average and look for their crossings.
- You can look for chart patterns (supports, resistances, double tops and bottoms etc.) because ZLEMA produces smoother information than Close prices do.
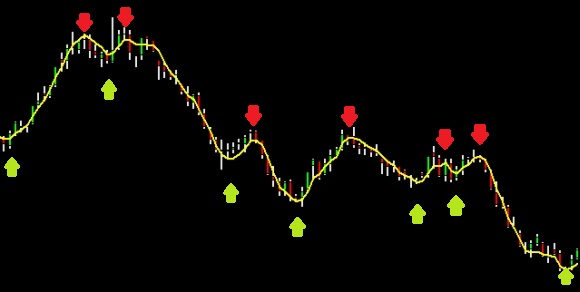
- You can also try to buy an asset when the ZLEMA values are rising and sell the asset when the values are falling. The image below illustrates this trading strategy. The yellow curve plots ZLEMA and the arrows display breaking points of the average.

