HMA indicator is a common abbreviation of Hull Moving Average. The average was developed by Allan Hull and is used mainly to identify the current market trend. Unlike SMA (simple moving average) the curve of Hull moving average is considerably smoother. Moreover, because its aim is to minimize the lag between HMA and price it does follow the price activity much closer. It is used especially for middle-term and long-term trading.
Moving averages are surely the most used technical indicators. There are popular, reliable, but their main disadvantage is their lag. The more days we include in their calculation, the more lag we get; so how to solve this problem?
As Allan Hull writes, HMA was just a result of intellectual curiosity. He noticed that popular Simple moving average is very slow and there is a significant lag between the average and the price. Just try to imagine price that would continuously rise – from 1 to 10 in ten consecutive days. The simple moving average of these prices would be 5.5. This is quite inaccurate number considering the fact that the current price is 10 units. So, to make the average more accurate, we can take the last 5 days and calculate the new average. It would be 8.0. It is much closer to the current price but still not enough. Now we calculate the difference (8.0 – 5.5 = 2.5) and add it to the latter number - and we get 10.5 units. This number is a kind of overcompensated but really very close to the current price. We can also say that it predicts the future data. Look at the picture below:

Hull decided to use WMA (weighted moving average) instead of simple moving average. The difference is that while SMA gives the same weight to all the prices in the calculation, WMA emphasizes more the current data compared to the older ones. Moreover, as we have used a combination of moving averages, the Hull moving average curve would be much smoother that the original price curve would be.
So, to conclude this, the HMA calculation looks like follows:
Define your HMA time period first, e. g. 16 days. Once you have determined the period (n), here is the formula for Hull moving average:
HMA = WMA [integer(√(n))] of {2 * WMA[integer(n/2); Close] - WMA(n; Close)}
That means:
- Calculate WMA (weighted moving average) for half of the period (8-day WMA in this case) and multiple the result by 2.
- Calculate WMA of the full period (16-day WMA) and subtract if from the first result (2 * WMA8).
- Calculate the square root of the full time period, i. e. √16 = 4.
- Calculate 4-day WMA from the result you got in step 2.
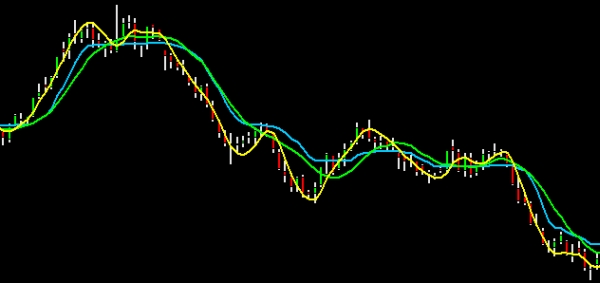
Note: If we choose a basic time period, which square root (or when divided by number 2) isn't an integral number (e. g. the result can be 3.2) then round it to a nearest whole number (integer = 3.0). To see how the HMA looks applied to a price chart, look at the picture below:

The yellow curve stands for HMA (Hull moving average)
The green curve stands for SMA (Simple moving average)
The blue curve stands for KAMA (Kaufman adaptive moving average)
All moving averages were set to 10 days. Hull moving average (yellow) is considerable faster than the Simple moving average (green). By the lag removing it can move much closer to the price chart (which is quite similar to ZLEMA indicator – Zero lag exponential moving average). ZLEMA is not plotted in the chart but have a look at the blue curve (KAMA indicator) when the market is indecisive and moves sideways - in our opinion, one of the best moving averages for trading, ever.
How to use the indicator for technical trading:
- Hull's Moving Average is used in a similar way like the ADX or Aroon indicators are, i. e. to identify the prevailing market trend. When the HMA curve is rising, then the prevailing trend is rising as well. Then it is better to enter some Long trades. Should the HMA curve be falling down there would be Downtrend prevailing so go Short.
- Allan Hull does not recommend trading on two HMA crossings. He uses first HMA to enter his trades and another one to exit them. He also recommends testing the turning points of Hull moving average as entry and exit signals. The picture below illustrates this trading strategy - HMA and its turning points that are used as buy and sell signals.

