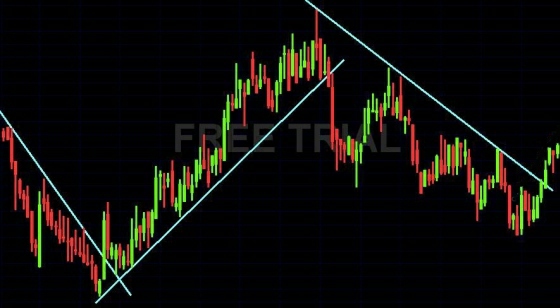
Trendlines are a variation of Support and Resistance. While Support and Resistance are formed on a horizontal line/price, Trendline supports the price from below, during an Uptrend. If there is a Downtrend prevailing, the Trendline resists the price from above. Simply said, Trendlines are a variation of Support and Resistance, that are formed in a trending market under an upward or downward angle.

Copyright © Picture made by Incredible Charts
How to use the Trendlines:
We follow the trend that is supported by a Trendline. Buy or Sell after the price approaches the Trendline and bounces back. We exit the trade after the price breaks through the trendline.
Stop Loss can be placed a number of ticks above/below the Trendline.
Bewarer: Trendline forms after the price bounces off the line for a third time. The more times the price bounces off the line, the stronger the Trendline becomes. While it reminds just a primitive trading tool, by its simplicity, it is very efective, on the contrary. Trendlines are a very popular trading technique. Their main disadvantage is that it is necessary to get used to them so they can be identified easily in the price chart. It is also necessary to redraw the trendlines in a price chart, quite often.
Price channels
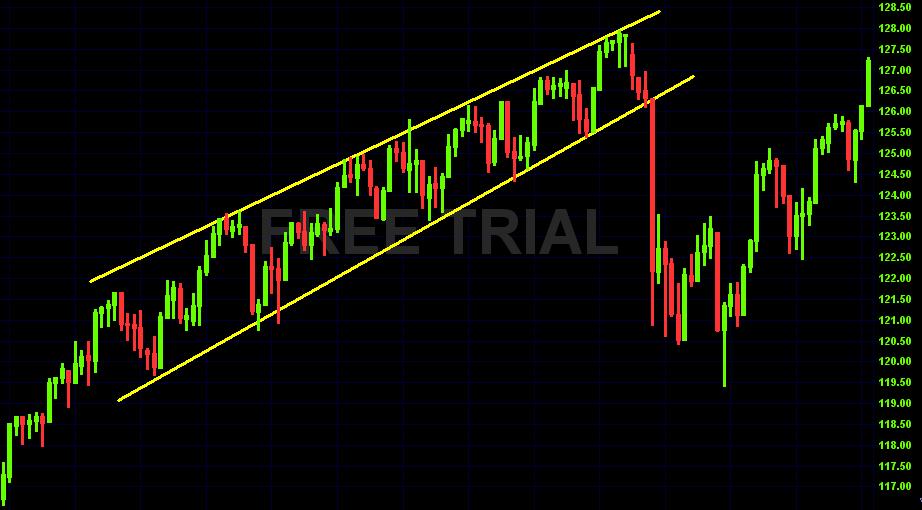
are a variation of Trendlines. While trendlines form Support and Resistance with an upward or downward angle, Price channels creates both S/R levels at the same time, i.e. both limits (Upper one and the Lower one, as well) inside which the price moves. The price trend can be predicted within the range. We go Long when price touches the Lower channel, we go Short when it touches the Upper channel,.

Copyright © Picture made by Incredible Charts
The Price channels can be used in the same way as the Trendlines. We should watch closely the Lower and Upper channels breakthroughs. In a case when such situation occurs, we Exit our trades or go in the direction of the breakthrough.
