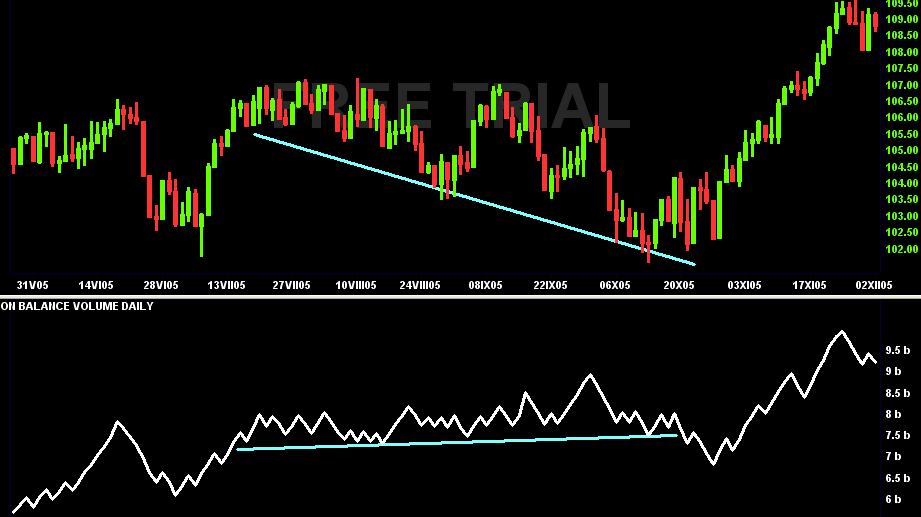
On Balance Volume was created by Joseph Granville in 1963 and described in his "New Key to Stock Market Profits" book. OBV is a momentum indicator. Its main idea is that a change of Volume goes before a change of Price.
The calculation is based on comparing yesterday's and today's Close. If today's Close is higher than yesterday's, then all the Volume is considered to be positive. If the Close is lower than it was yesterday, the whole Volume is negative. OBV points out to the fact, that the money is going in or out of the asset (buying or selling pressure).
OBV calculation:
If CLOSE n > CLOSE n-1 => Add theVolume to OBV total
If CLOSE n < CLOSE n-1 => Subtract the Volume from OBV total
If CLOSE n = CLOSE n-1 => OBV total remains the same

Copyright © Picture made by Incredible Charts
How to use the OBV indicator:
If the OBV values rise and reach higher High and higher Low, we search for the possibilities to go Long. It they fall and the OBV indicator reaches just lower High and lower Low, it's better to enter some Short trades. It is also true that if the Price increase isn't followed by OBV increase, the Uptrend is probably exhausted and it is about to change. The same for price fall that is not followed by OBV decrease.
In general: Price direction (increasing or decreasing) must be in line with the OBV direction. If they are different, price trend is not confirmed then and its reversal can be expected soon.
