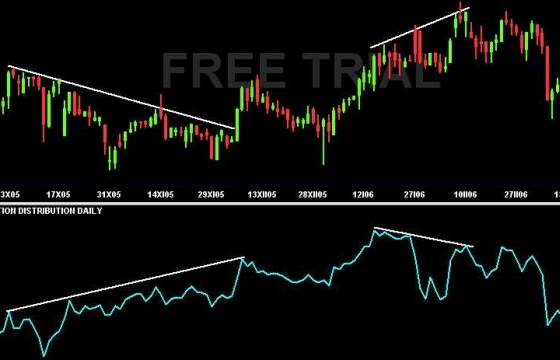
Accumulation/Distribution Line was created by Marc Chaikin. The indicator is constructed in a similar way as the On Balance Volume is.
Its main task is to determine whether the traders are accumulating (buying) or distributing (selling) assets and determine who controls the market - buyers or sellers.
Its construction is as follows:
CLV = [(Close – Low) – (High – Close)] / (High – Low)
A/D = ∑ n (CLV * Volume)
CLV = Close Location Value
A/D line cumulates daily CLV differences, multiplied by weight significance, which is just their daily volume. The more significant the Price increase/decrease at higher Volume is, the more significant the CLV for the calculation of A/D line and its total value is.

Copyright © Picture made by Incredible Charts
How to use the indicator:
Especially the Positive a Negative divergences with the Price graph are quite important. If the price graph rises and A/D values falls, it means the traders terminate the accumulation/buyings. The Uptrend is to cease shortly. The opposite stands for the Downtrend and rising values of A/D line.
It's allways better to use another indicator for trade confirmations than to use the A/D Line exclusively.
If a new price High is supported by a new A/D High, it confirmes strong Uptrend. On the other hand new price and A/D Lows confirm strong Downtrend.
