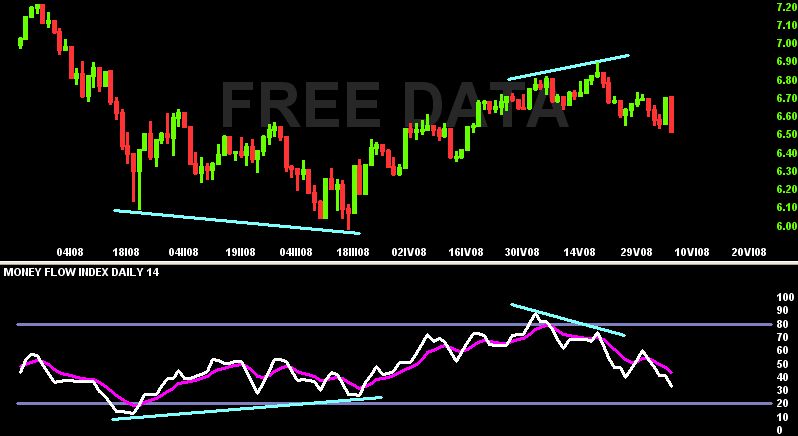
Money Flow Index is a momentum oscillator. It was created by Laszlo Birinyi Jr. and measures the strength of investments comming into and out of the asset (in other words it measures the Volume during market rises and falls). So MFI indicator is mostly used to measure the strength of the trend prevailing on the market.
Money Flow Index is an option to RSI in conjunction with Volume (or we can compare it to On Balance Volume, as well). MFI values move in the range from 0 to 100 and the indicator is mostly calculated during 14 time periods.
Money Flow Index describes the relations among Price of the asset, its Volume and actual Demand for the asset. MFI formula looks like follows:
Typical price = (H + L + C) / 3
Money Flow = Typical price * Volume
Money Flow Index calculation is based on "positive money" and "negative money" comparison. The Typical price itself defines whether the money flow is positive or negative. If it is higher than it was yesterday, the money is positive. If the typical price is lower than it was yesterday, the money is negative. If we calculate Money Flow Index in the time period of 14 days, than summing all the positive money during these 14 days gives us "positive money flow". Summing all the negative money during the period gives us the "negative money flow". By dividing the "positive money flow" and the "negative money flow" we get a "money ratio".
The number of days, at which the MFI calculation is based on depends primarily on the cycle length we trade. If we choose too short cycle, than the MFI values become very volatile. It is possible to smooth them by Moving Average additionally.
Money Ratio = Positive money flow / Negative money flow
MFI = 100 – [ 100 / (1 + Money Ratio)]

Copyright © Picture made by Incredible Charts
How to use the MFI:
MFI can be used in a similar way as the RSI indicator is, including oversold and overbought conditions and positive and negative divergences, as well.
If the price falls and indicator values rise then it means the Bulls and their capital gets "stronger", so the trend reversal from the Downtrend to Uptrend can be expected and vice versa.
MFI values above 80 points can be considered being overbought. Values bellow 20 points signalize oversold level. If the values oscillate around the 50 level, there is probably a Ranging market.
Note: The construction itself is based on a simple idea - if the asset price rises and the Volume is low, then the actual trend is very weak. We can expect trend reversal comming soon. Price increase 5 $ at a Volume of 100 units is much less significant than 1 $ price increase at the volume of 10,000 units. The same for the opposite conditions i.e. Downtrend with a low Volume. The trend reversal to an Uptrend can be expected then.
