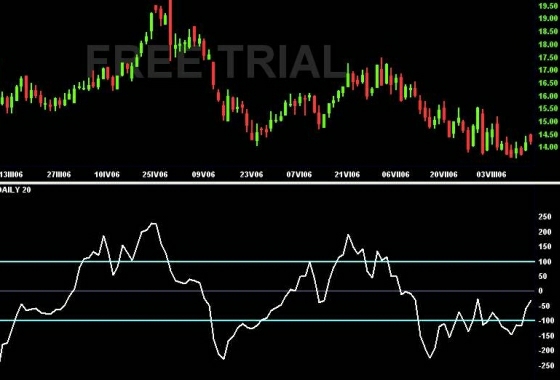
Commodity Channel Index measures the relations among the asset price, its moving average and standard deviation. It simply measures the speed at which the price and its swings retreat from its average values. The market volatility is taken into consideration as well.
The indicator is used to identify the oversold/overbought levels, but it doesn't work much like RSI, Stochastic etc. These indicators are bounded by the limits from 0 to 100, while CCI does not use any limits. It's values usually move between -300 and +300 points (even though 75 % of the values move between -100 and +100).
Commodity Channel Index - CCI was created by Donald Lambert. He described it in his: "Commodity Channel Index: Tools for Trading Cyclic Trends" book. As you can see from the title, CCI was created to identify and make use of the cyclic swings and reverse points on the market.
CCI formula looks following:
CCI = (∑(Ct – SMA) ) / (0,015 * MD)
SMA = Simple Moving Average
MD = Mean Deviation
Ct = Typical price
Ct = (High + Low + Close) / 3
The usual settings of CCI are 14 or 21 days. It's a matter of fact that the lower number of days you use for its construction, the more volatile the indicator becomes and it gives more signals. To follow Lambert's recommendations, the appropriate settings are 1/3 of the common market cycle. So, if the standard cycle last 30-days, then it is recommended to use 10-days CCI. Should the cycle last for 60 days, then the 20-days CCI would be fine to use.

Copyright © Picture made by Incredible Charts
How to use the CCI indicator:
There is a couple of ways how to use it. The basic ones are:
- To buy the asset if the CCI breaks through the -100 limit upwards and to sell if the CCI breaks +100 limit downwards. This is quite useful on the ranging market (if there isn't any significant trend). By these rules we try to identify the reverse points in advance. So we can get clear signals of overbought and oversold conditions, that we can make use of.
- Searching for the positive and negative divergences. This is quite useful to follow on a market with a significant trend on it.
Beware! There is a lot of ways how to use the CCI for trading.
In the first way mentioned, we buy, if the CCI break through the -100 level upward. But there is also another way how to trade. We don't Buy, just close our Short positions. The Short positions were opened at the moment when CCI crossed -100 level downwards.
The opposite is true, if the CCI crosses +100 level downwards. Some traders don't sell, just close their Long trades. They entered the Long trades at the moment when CCI crossed +100 upwards. (It means the traders trade just in the zone above +100 and bellow -100!). This trading is based on the situation when the market is trending, not ranging, so we don't rely on any market cycles. It's allways best to know the market, you want to trade, very well, so you can estimate the prevailing conditions and modify the indicator according to your own wishes.
Don't hesitate to try various setting of Commodity Channel Index. Btw. it's appropriate to combine the CCI indicator with other one, so the Buy and Sell signals can be confirmed. But there are also some traders that adapted the CCI in such a way, that they can use this indicator for trading exclusively. If the conditions are not clear enough, they add the moving average or MACD, to identify the prevailing trend.
CCI became very popular especially during last years. Its advantage is that once you know it very well and adapt it according to your requirements, it contains almost all the information you need to make the decisions.
In the end: CCI is quite popular thanks to well known trader Ken Wood, as well. He made several studies about using CCI indicator for trading and suggested some basic CCI patterns that can help to identify the right time to Buy or Sell. This variations of CCI is known as WCCI (Woodie's Commodity Channel Index).
If you are interested in a deeper study of this technical indicator and prefer ready to serve solutions, this section may be of interest to you. There you can find all the available indicators in Excel file for download.
