
KAMA is an abbreviation of Kaufman Adaptive Moving Average. This indicator of technical analysis was created by an American trader Perry Kaufman (he is also an expert in creating algorithmic trading programs).
KAMA indicator belongs to into the group of adaptive moving averages. Moving averages, generally, follow the price and its development for a certain period of time. E.g. if a trader decides to calculate 10-day Simple moving average, the actual moving average value is calculated always from the last 10 days. Sometimes a greater weight can be put on the most actual days, like Weighted moving average does, but the important thing is that the 11th day does not have any effect on the calculation as it falls beyond the selected time range.
Unlikely the common moving averages, the adaptive moving averages can change number of days for their calculation. As the conditions on the market change, the adaptive moving averages follow the current situation and adapt themselves. That’s their biggest advantage. The conditions under which they change can be different. KAMA changes the days for its calculation according to actual market noise and volatility. If the prices move steadily (doesn’t matter if they rise or fall) the noise of the market prices is low, the KAMA follows the price curve very closely. If the prices jump up and down (once they rise, once they fall) the volatility is very high and KAMA would follow the price chart from a greater distance. This enables the trader to get less false trading signals and to improve his trading system rapidly.
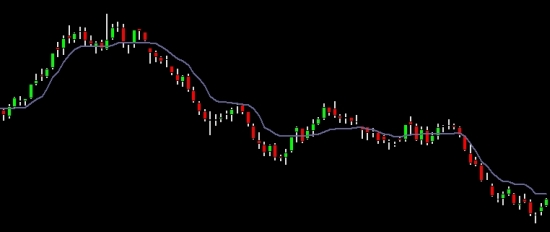
This image dispays OHLC prices and KAMA indicator so you can see how it behaves (KAMA set to 6 days, Short Alpha 0.6 and Fast Alpha 0.06).
1. Calculate the Direction of the market for a chosen period of time (e.g. 10-days KAMA). The market direction for the last 10 days can be then calculated as:
[ABS (Close 0 – Close -9)],
where:
Close 0 means the most actual day’s close price and
Close -9 means close price 9 days ago
The reason why we take into account price 9 days ago (and not 10 days) is because the first day in the calculation is the 0 day (in other words despite the fact that we take into account 10-days price difference, the 10th day price is marked as Close -9). If we would like to calculate 2-days KAMA, we would take into account Close 0 and Close -1.
∑ [ABS (Close t – Close t-1)],
where:
Close t is the Close price of every of the days in the calculation and
Close t-1 is the Close of the previous day (e.g. Close 0 – Close -1; Close -1 – Close -2 etc.). As we have 10-days in the calculation, we get 9 differences in absolute (positive) values. These absolute differences reflect the market noise or volatility during the chosen period. Efficiency ratio fluctuates between 0 and 1 and tells us what the market noise is (or volatility of the prices). The Efficiency ratio would equal to 1 if the prices would rise 10 consecutive periods or fall 10 consecutive periods. The Efficiency ratio would equal to 0 if the prices have not changed over the 10 consecutive periods.
This is also the point where a lot of traders makes the basic mistake (and almost every website makes the same mistake) as they take into account 10 differences for 10-days KAMA calculation instead of 9 differences. Well, maybe that seems right and more logical at a first glance so let’s have a closer look at this matter. Do you remember the classic Simple moving average that has been aforementioned (if not, just try to find it again in the text above). So, if we want to calculate 2-days Simple moving average, we take into account just last 2 prices and the price 3rd day is not important to us at all. Let’s suppose the prices for last three days would look like this:
Price 0 = 100
Price -1 = 90
Price -2 = 100
Using the Simple moving average formula, we would get the 2-days SMA value of 95. That seems right, doesn’t it? OK, now the 2-days KAMA calculation.
The market direction of the last 2 days equals to 10 points.
The market volatility is also 10 points (100 – 90 = 10).
Then, if you calculate the Efficiency ratio, you will get a value that equals to 1 (or 100 %) what in fact means that 100 % of the price change within the chosen period has been made in the same direction. In other words the Efficiency ratio tells us that the price has been either rising or failing all the time.
That is valid if you take into account just 1 difference for a 2-days KAMA calculation, but most websites, traders or analytics overlook this fact and they work with 2 price differences (which means they include in the calculation the 3rd day as well). So, despite the fact that we are interested just in the 2-days KAMA and should work with the Direction that equals to 10 and volatility that equals to 10 as well, as a matter of fact, most people who don’t take into account this slight difference would work with Direction that equals to 10 and Volatility that equals to 20. Then they get Efficiency ratio that equals to 0.5 which means that the price has been rising 50 % of the time and falling 50 % of the time as well. That would be right for the last 3 days, but not for the last 2 days.
ER = Direction / Volatility
4. Calculate the SC (Smoothing constant). The Smoothing constant consists of the ER and two “alphas” from Exponential moving averages. ER is already known to us. We have to calculate the “alphas” now. One alpha represents fast exponential moving average and the second one slow exponential moving average. We can call them Fast Alpha and Slow Alpha. Kaufman recommended to use 2-days moving average as the Fast Alpha and 30-days moving average as the Slow Alpha. These two moving averages are then responsible for how the KAMA behaves when the market is quite and nothing happens and when it is stormy with many moves up and down. The fastest moving average is included in the KAMA calculation when the market is quite (and so we follow the price very close) and the slowest moving average is included in the calculation when the market is very volatile (the KAMA curve is moving away from the price so it could let the price “take a deeper breathe” and the trader doesn’t get different signals to buy and sell everyday).
So if we choose to use the Alphas from 2-days and 30-days Exponential moving average, the calculation looks like this:
Fast Alpha = 2 / (2+1) = 0.6667
Slow Alpha = 2 / (30+1) = 0.0645
This ensures that the days for KAMA calculation will always vary between 2 and 30 days. Should anyone want to use longer moving average than the 30-days moving average is, he could calculate new Alpha, e.g. 100-days Alpha equals 2 / (100+1) = 0.0198. In such case, the KAMA calculation would always be based on a number of days between 2 and 100.
The SC (smoothing constant) itself looks like this:
SC = [ER x (Fast Alpha – Slow Alpha) + Slow Alpha] 2
So in this case the SC would equal to:
SC = [ER x (0.6667 – 0.0645) + 0.0645] and this equation would be squared.
KAMA 0 = KAMA -1 + SC * (Price 0 – KAMA -1)
If you are familiar with the Exponential moving average calculation, you can see that it is almost the same. The main difference between Exponential moving average and Kaufman adaptive moving average lies in the fact that while EMA uses always the same number of days for its calculation, KAMA can change this number. The number of days change is ensured by the Smoothing constant and the Smoothing constant change is in fact based on the Efficiency ratio. This closes the circle. E.g. if the price would not change at all and would remain steadily then:
Direction of market would equal to 0,
Efficiency ratio would equal to 0,
Smoothing constant would equal to Slow Alpha (squared)
KAMA would equal to the chosen Slow Exponential moving average (30-days EMA, but there would be slight difference because of the squared SC equation).
Similarly, if the price would rise all fall all the consecutive days in the calculation, then the market Direction and Volatility would equal, the Efficiency ratio would be 1 and Smoothing constant would equal to Fast Exponential moving average (2-days EMA).
KAMA indicator belongs to trend-following indicators. Similar to any of the moving averages like HMA (Hull's moving average), T3 moving average, FRAMA (Fractal adaptive moving average), DEMA (double exponential moving average) etc. it follows the price so you can use it to identify the dominant trend on the market. This would require to set the days for Fast and Slow Alphas to higher numbers – e.g. to cover the time range between 50 and 200 days. So KAMA would become more robust and would show us just the main market moves. Then if the KAMA rises, the trend is rising as well and vice versa. Unlike the trend indicators like ADX or Aroon indicator, you can think that KAMA would not show us the strength of the trend, just the dominant trend itself. But that would be true just at a first glance. If you have understood the KAMA calculation you could find out there it contains a very interesting part called Efficiency ratio. The ER shows us, how big the price change was within the selected number of days. In other words, if the ER equals to 1 it means that all the day prices in the calculation moved in the same direction (what in fact means a strong trend) and if the ER equals to 0 it means that the day prices were not moving at all (that signalizes an absence of any trend).
Other possibility how to trade with KAMA would be to follow the Close price and KAMA values crossings. Should the Close prices be higher than KAMA values, we go long. Should the Close prices be lower than KAMA, we go short.
We can also trade KAMA crossings. This would need to prepare two different KAMAs. One that would be based just on faster Alphas and other one that would use slower Alphas for their calculation. Then you can follow their crossings. Should the faster KAMA get above the slower KAMA, we buy and vice versa.
As KAMA indicator is very robust and universal we could also try to use it as a part of any other indicator, e.g. to use it in the Bollinger Bands instead of Simple moving average or use it in MACD instead of Exponential moving average.
As you can see, KAMA is really an extraordinary indicator of technical analysis that gives us many interesting information and possibilities how to use it.